Purpose: Use the Document Management screen to work with reports generated by CWSerenade.
How are reports different from forms? Reports are listings that present summary or detail information for use by staff, while forms include specific information for a single customer, vendor, or order, and are available for distribution to the customer or vendor. For example, the Pick Unit report lists total single-line and multi-line picks generated, while each generated pick slip form includes the customer’s name and address and details about the order that is shipping with the pick.
PDF files: Each report is generated as a PDF (portable document format) file, typically opened through the Adobe Reader or within a separate browser window. Certain reports are also available in comma-separated value (CSV) format, so you can work with them in a spreadsheet application such as Microsoft Excel®.
Auto-print report: If you have defined a printer and selected the Auto Print? field for a report in Working with Report Control (WRPT), CWSerenade automatically sends the report to the printer once it has been generated; see Auto-Print Documents for more information.
In this topic:
• Reports Available in CSV (Spreadsheet) Format
How to display this screen:
• Click the My Docs
icon ( in the upper right area of a screen), or select My Docs from an Admin screen (such as
the About Application, Forms
Management Screen, Job
Management Screen, Commands, User Control, or System
Messages screens). When you advance to the screen this way, it displays
all reports generated through your user ID through any submitted job.
See the fields below for information on how to filter the reports listed
on this screen.
in the upper right area of a screen), or select My Docs from an Admin screen (such as
the About Application, Forms
Management Screen, Job
Management Screen, Commands, User Control, or System
Messages screens). When you advance to the screen this way, it displays
all reports generated through your user ID through any submitted job.
See the fields below for information on how to filter the reports listed
on this screen.
• Click the report icon (![]() ) for a submitted job at the Job
Management Screen (My
Jobs) to display the reports generated for that particular
job only.
) for a submitted job at the Job
Management Screen (My
Jobs) to display the reports generated for that particular
job only.
Report Listings and Display Options
Default settings for reports available for review: When you first advance to this screen, up to 25 reports submitted by your user ID are currently available for review by scrolling up or down with the right-hand scroll bar. The reports are listed in reverse chronological order (newest to oldest).
Available reports updated when you filter: When you enter or select any search criteria and then click Filter, the screen displays up to 25 reports that match these criteria.
Example: The screen currently includes 25 reports available for review in reverse chronological order (newest to oldest): 20 of these reports are in the QPRINT queue, and 5 are in the DOCUMENTS queue. When you select QPRINT from the Queue field and click Filter, the screen displays up to 25 reports in QPRINT.
Adding reports for review with the More option: Select More to add additional reports to those available for review by scrolling with the right-hand scroll bar. This option is available only if additional reports exist that meet the current filtering settings. Each time you click More, you add a maximum of 25 reports to those available for review.
Examples:
• A user has generated 37 reports. When the user advances to this screen, 25 reports are available for review and the More option is also available. When the user clicks More, the additional 12 reports are added to those available for review, and the More option is removed.
• A user has submitted 53 reports. When the user advances to this screen, 25 reports are available for review and the More option is also available. When the user clicks More, an additional 25 reports are added to those available for review, and the More option is still available. When the user clicks More again, the remaining 3 reports are added to those available for review, and the More option is removed.
• A user has submitted 16 reports. When the user advances to this screen, all 16 reports are available for review, and the More option is not available.
Filter criteria applied to additional reports: If you currently have any filter criteria selected when you select More, the additional reports displayed match your criteria.
Example: If the reports are currently filtered based on a user ID of DTHOMAS, selecting More adds up to 25 more reports that were also generated by the user DTHOMAS.
Available reports restricted by Rank and All job authority: You can review reports generated by other users only if their user control Rank does not exceed yours, and only if your user control record has All job authority selected.
Example: |
Users JKEATS has a Rank of 9, with All job authority selected. User WBLAKE has a Rank of 9, with All job authority unselected. User RBROWNING has a Rank of 1, with All job authority selected. Result: • JKEATS can review reports generated by WBLAKE because their Rank is the same; however, JKEATS cannot review reports generated by RBROWNING, because a Rank of 1 exceeds a Rank of 9. • WBLAKE cannot review reports generated by any other users, because he does not have All job authority. • RBROWNING can review reports generated by all other users based on his Rank and All job authority. |
Note: Different rules control the authority to view forms and reports than the rules that affect the Job Management Screen. The user’s Rank does not affect authority to view jobs.
Column sort: You can sort on any column by clicking the upward-facing and downward-facing arrows to the right of a column heading name. When you first click, the sort is in ascending alphanumeric (A-Z) or numeric (lowest to highest) order. Click again to change the sort to descending (Z-A) or numeric (highest to lowest) order.
Field |
Description |
Document |
The program that generated the report. Click the document name to open the report in a separate browser window. From this window, you can review and optionally print the report, using the standard Windows print options for your PC. Note: • The CSV icon ( • The glasses icon ( • If you already have a separate browser window open to review another report or a form, the system does not open an additional window; instead, the previous form or report is replaced with the recently-selected report. Filter options: • to display reports by document name: enter a full or partial document name and click Filter • to display reports regardless of document name: if you have previously entered a full or partial document name, clear the entry and click Filter |
Job name |
The job that generated the report. Filter options: • to display reports by job name: enter a full or partial job name and click Filter • to display reports regardless of job name: if you have previously entered a full or partial job name, clear the entry and click Filter |
Output queue |
The output queue identifying the folder on your CWSerenade server where the report is saved. The default output queue is QPRINT for some reports and DOCUMENTS for others. See Reports Troubleshooting for more information. Filter options: • to display reports for a single output queue: select the output queue from the drop-down list and click Filter to display reports in that queue • to display reports regardless of output queue: if you have previously selected an output queue, change the selection to ALL and click Filter |
Pages |
The report’s length in pages. Note: If you advance to the Document Management screen before the job has finished generating the report, the number of pages indicated here might not be correct until the job completes. Filter options: • to display reports by number of pages: enter a number and click Filter to display reports with that number of pages or more • to display reports regardless of number of pages: if you have previously entered a number of pages, clear the entry and click Filter |
Date |
The date and time when the report was generated. Filter options: • to display reports
generated on or after a specific date: click the calendar
icon ( • to display reports generated on the current date: click the calendar icon, select Today from the bottom of the calendar, and click Filter • to display reports regardless of the date generated: if you have previously selected a date, click the calendar icon, select Clear from the bottom of the calendar, and click Filter |
User name |
The user ID of the person who generated the report. Your user ID defaults. When you use the CWProcessIn message to start a periodic process, the forms are listed under your default user; see Using the CWProcessIn Message to Start a Periodic Process for background. Filter options: • to display reports generated by another user: enter a complete, valid user ID and click Filter • to display reports regardless of the user who generated them: • clear the current entry in this field, or enter ALL, and click Filter, or • right-click anywhere in the Report listings area and click Show All Docs • to restrict the reports displayed to your own user ID after changing the default: right-click anywhere in the Report listings area and click Show My Docs Note: • Entering a different user ID and the Show All Docs and Show My Docs options are available only if the user control record has the All Job Authority setting selected. • When you select the Show All Docs option, it sets this field to ALL; but the screen does not display reports generated by users whose rank is higher (a lower number) than your own. |
Status |
The only status currently implemented is READY (the report is ready for review). |
Job |
A system-assigned identification number to track the job generating the report. Filter options: • to display reports for a particular job number: enter a valid job number and click Filter • to display reports regardless of job number: if you have previously entered a job number, clear the entry and click Filter |
 ) indicates that the report has already been reviewed in a prior
session, by you or another user. This icon also displays if the report
was automatically sent to a printer; see
) indicates that the report has already been reviewed in a prior
session, by you or another user. This icon also displays if the report
was automatically sent to a printer; see Document Management Screen Options
Option |
Procedure |
Review, and optionally print, a generated report |
Click the file name to open the report in a separate window. From this window, you can print the report using the printers currently available to your local PC. Note: The system keeps a single additional window open for you to review a report or a form. If you already had a report or form open in the additional window, the system replaces the document previously displayed with the report you have just selected. Reopen the additional window to review the recently selected report. |
Change which reports are displayed on the screen |
|
Restrict or expand the list of displayed reports based on one of the available column headings |
See the Report Listings and Display Options for information on how to filter the reports displayed based on various criteria. |
Display additional reports that match the criteria currently in place |
By default, the screen lists a maximum of 25 reports at a time. Select More to add additional reports to those available for review. This option is available only if there are additional reports that could be available. See the Report Listings and Display Options for more information and examples. Note: When you select More: • Any current filter criteria (such as user ID or queue) are retained, and up to 25 additional reports that match your criteria are displayed. For example, if the reports were currently filtered based on a queue of QPRINT, when you select More, the screen adds up to 25 additional reports in the QPRINT queue to those available for review. • If the selection checkboxes to the left of any reports are currently selected, the checkboxes are cleared. |
Refresh data listed on the screen |
Click Filter. Newly generated reports are added to the screen in READY status as they are generated. |
Sort by column |
Click the upward-facing and downward-facing arrows to the right of a column heading name. When you first click, the sort is in ascending alphanumeric (A-Z) or numeric (lowest to highest) order. Click again to change the sort to descending (Z-A) or numeric (highest to lowest) order. |
Delete one or more reports |
|
Delete an individual report |
• Select the checkbox to the left of a report. • Right-click anywhere in the Report listings area, then click Remove. |
Delete all displayed reports |
• Right-click anywhere in the Report listings area, then select Select all. • Right-click again anywhere in the Report listings area, then click Remove to delete all displayed reports. Note: • Click Unselect all if you clicked Check all inadvertently or do not want to delete all displayed reports. • Only reports that are currently available for display are selected when you use the Select All option. By default, a maximum of 25 reports are eligible for display when you first advance to the screen, but by selecting the More option you can display additional reports in groups of up to 25. |
Display additional information about a report or advance to a different screen If you advance to a different screen and then return, your filter entries are not retained. For example, if you are currently filtering on a specific queue, and you advance to the Job Management (My Jobs) screen and return, the Queue column no longer filters on that queue. |
|
Display the server where you generated a report |
Move your cursor over the job name. The Command field displays the name and IP address of the server where the job generating the report was submitted (for example, Submitted on server:cwserenade-pdn/192.168.255.255). Note: This information is not displayed for reports generated through an interactive session rather than through a submitted job. For example, if you receive a purchase order and this generates the Receiving Worksheet -- Weight Method or PO Receiving Worksheet -- Unit Method, the information on the server is not displayed. |
Display information about CWSerenade |
Select About. |
Advance to the Forms Management Screen screen |
Select My Forms. |
Advance to the Job Management Screen |
Select My Jobs. |
Advance to the Advanced Commands screen, where you can advance to working with user control records if you have sufficient authority |
Select Advanced commands. |
Return to the Job Management Screen |
Select Back. This option is displayed only if you advance to the Document Management screen from the Job Management Screen; otherwise, you can select My Jobs to advance to the Job Management Screen. Note: If you use the Filter option at the Job Management Screen to display jobs other than the default (for example, your user ID, all jobs regardless of status), then the filter options remain in effect when you return to the Job Management Screen. |
Return to the previous CWSerenade screen |
Select Exit. |
Reports Available in CSV (Spreadsheet) Format
Purpose: Certain reports are available as CSV (comma-separated values) files, which you can easily open in a spreadsheet application such as Microsoft Excel® and then work with the data to suit your business requirements. Reports available in spreadsheet format are:
Report |
Fast Path |
DGLI |
|
DGLI |
|
GSLT |
|
LIPS |
|
|
Note: Only the sort by Category $ Sold Ascending and by Item $ Sold Ascending are available in CSV format, but you can use your spreadsheet application to sort the data as needed. |
MISA |
|
Note: Only the sort by Item Warehouse is available in CSV format, but you can use your spreadsheet application to sort the data as needed. |
MISS |
MPAR |
|
MPAR |
|
MPIR |
|
MRDU |
|
MSRP |
|
OPAR |
|
Backorder Report by Descending Dollars by Division/Warehouse Note: This is the only version of the backorder report by descending dollars that is available in CSV format, but since the data is the same in other versions, you can use your spreadsheet application to sort the data as needed. |
PBOD |
PBOR |
|
PBOR |
|
PBOR |
|
PBOR |
|
PBOR |
|
PCRJ |
|
PCRJ |
|
PDHD |
|
PDHS |
|
PDSJ |
|
PDSJ |
|
PDTS |
|
PERR |
|
PERR |
|
|
. The spreadsheet format is available regardless of whether you select the Print SKU detail option when you generate the report. |
PEXD |
PFRC |
|
PFRC |
|
PHOR |
|
PITH |
|
PIUR |
|
PMTR |
|
POCT |
|
|
Note: If there is a page break in the printed report within the items listed for a single warehouse, the warehouse column headings (warehouse code and description) are included as an additional row in the CSV file. On Hand by Vendor by Warehouse Report Note: If there is a page break in the printed report within the items listed for a single warehouse and vendor, the warehouse and vendor column headings (warehouse code and description and vendor code) are included as additional rows in the CSV file. |
POHW |
POPA |
|
POPP |
|
POQR |
|
POTS |
|
PPCR |
|
Product Performance Report (Ordered Totals) Note: Only the sort by ascending items or by descending total dollars are available in CSV format, but you can use your spreadsheet application to sort the data as needed. |
PPPR |
Product Performance Report (Shipped Totals) Note: Only the sort by ascending items or by descending total dollars are available in CSV format, but you can use your spreadsheet application to sort the data as needed. |
PPPR |
PPRR |
|
PPSR |
|
PROR |
|
Sales Journal Summary by Period |
PSJM |
PSJO |
|
PSJP |
|
PSRR |
|
PSSR |
|
PSTD |
|
PSTX |
|
PTCR |
|
PUSA |
|
PUSA |
|
RSCA |
|
RSCA |
|
SDEP |
|
WOBR |
|
WSPS |
|
N/A (generated through SLSSMOT periodic function) |
Opening the CSV file as a
spreadsheet: The CSV icon (![]() )
next to the report indicates that the report is available in CSV format
(such as the STRECEIPT report in the image below):
)
next to the report indicates that the report is available in CSV format
(such as the STRECEIPT report in the image below):
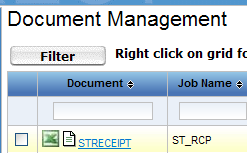
Click the CSV icon to work with the report in your default spreadsheet application. A window opens asking if you would like to open or save the selected file.
Things to note:
• Formatting: When you initially open the report in your spreadsheet application, the data might not be formatted to your preferences. For example, certain columns might appear too narrow to display their full contents. Also, alphanumeric fields that can also include numeric values (for example, the item code) might be in cells that are formatted as numeric data. In this situation, changing the cell properties to text can correct the alignment.
• Totals: For the most part, totals and subtotals that appear on the PDF version of the report are not included in the CSV file. You can use your spreadsheet application to insert rows for totals or subtotals and perform any required calculations. The exception is the Source Analysis Recap Report (RSCA), which does include subtotals and totals.
• Blank columns and rows: Columns and rows that can include data are included in the CSV file, even if there is no relevant information for the column or row in your report results. For example, when a report includes a separate column to flag order lines that have VAT charges, this column is blank in your CSV file if you do not charge VAT in your company.
• Negative amounts: For negative amounts and quantities, the minus sign is on the left side in the CSV file (rather than the right side, as it appears in the PDF version) so that your spreadsheet application can correctly render the negative values and include them in calculations.
• Page breaks and column headings: Page breaks in the PDF version of the report are not represented in the CSV file as repeated column headings unless they also introduce a new grouping of data. For example, the sales journals are each broken out into separate groupings, such as by invoice date and pay type, so in these reports the column headings repeat for each grouping in the CSV file.
• Automatic backup of CSV files: If you leave a CSV file open for a period without saving it, your spreadsheet application may display an error message. This error occurs because the spreadsheet application attempts to back up working files periodically, and the CSV file name includes invalid characters. To avoid seeing this error message, save the CSV file using a logical, valid file name soon after opening it.
• Deletion of CSV files: When you remove the report at the Document Management screen, or remove the job at the Job Management screen, the system deletes both the PDF file and the CSV file.
Some possible troubleshooting questions and answers are:
Question |
Possible Answer(s) |
Where are generated reports located? |
Typically, reports and the XML files used to generate them are stored in C:\CWSerenade\serverconfig\outputqueues`PRINT or C:\CWSerenade\Forms\Documents (where C: is the root drive of your CWSerenade server). Contact your system administrator to confirm whether your configuration saves reports in a different location. |
Why are some reports generated in the QPRINT queue, while others are generated in the DOCUMENTS queue? |
Reports generated through Jasper are in the DOCUMENTS queue; all other reports are in the QPRINT queue. |
Are reports automatically deleted? |
Reports older than the JOB_RETENTION_DAYS property in Working with Customer Properties (PROP) are deleted, along with the related jobs, when you restart CWSerenade. |
Why are the outer portions of the page cut off when I print a report? |
Make sure that the Page scaling option in the Print dialog box is set to Fit to printer margins or Shrink to fit when printing a form to prevent information on the edge of the page from being cut off. |
Why doesn’t a new window open when I click the name of a report at the Document Management Screen? |
The system keeps a single additional window open for you to review a form or a report. If you already had a form or report open in the additional window, the system replaces the document previously displayed with the report you have just selected. Reopen the additional window to review the recently selected report. |
I removed a job at the Job Management Screen and now I cannot find the report. Why? |
Deleting a job automatically deletes the reports generated through that job. |
Why wasn’t a job deleted when I removed all of its generated reports at the Document Management Screen? |
Deleting all generated reports for a job does not automatically delete the job. Use the Job Management Screen (My Jobs) to delete the job. |
How can I find out about the data on a report? |
Use the Reports listing to find a link to a description of the report and a report sample. |
Why is there a single line of detail information on page two of a report, and then the third page of the report is labelled “Page 2"? |
Contact your MICROS representative if this issue occurs on one of your generated reports. |
Why does the Document Management Screen indicate that a report is 1 page long, while the report is actually longer? |
If you advance to the Document Management Screen while the report is still being generated, the number of pages indicated at the screen might be incorrect until the job completes. |
| Working with Report Control (WRPT) | Contents | SCVs | Search | Glossary | Reports | Solutions | XML | Index | Job Management (My Jobs) |
Document Management OROMS 5.0 2018 OTN